Gold Prices Could Be Set for a Big Rally
Gold prices could be setting up for a massive run to the upside. Gold bugs have waited for this for a while.
Gold price charts are saying the price of the yellow precious metal could go a lot higher. $3,000-an-ounce gold could come much faster than expected.
Advertisement

First, look at the very long-term gold price chart. Remember this very basic rule of technical analysis: the trend is your friend until it’s broken.
The long-term trend for gold prices remains intact.
This trend has been tested several times, and each time, it has shown resilience. When the long-term trend was tested in 2022, gold prices never broke below the trend. In fact, each time gold prices have touched the long-term trend, the next move up has been robust.
So, will this time be any different? Assuming the uptrend remains, the outlook for gold is bullish.
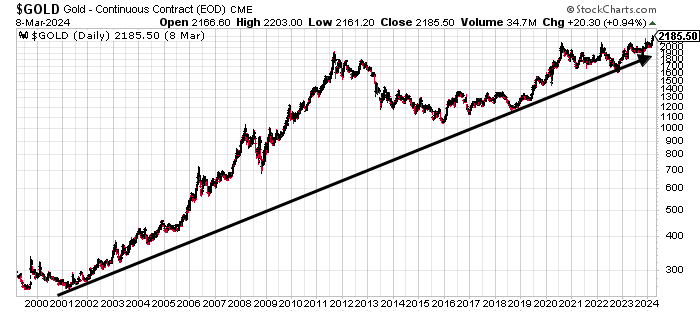
Chart courtesy of StockCharts.com
This Chart Pattern Says $3,000/Ounce Gold Price Could Be a Real Possibility
The following chart shows gold prices over a shorter time frame.
This chart shouldn’t be anything new for long-term readers of Lombardi Letter. However, there have been some new developments that have made the case for higher gold prices a lot stronger.
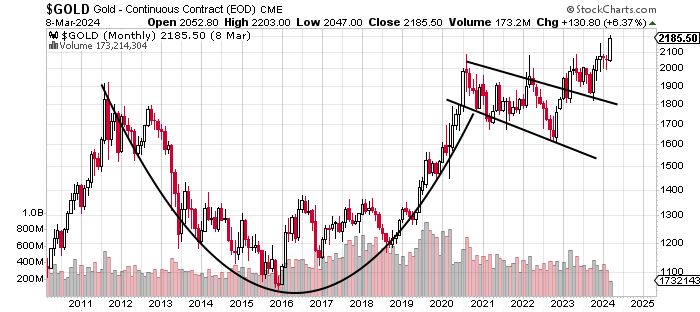
Chart courtesy of StockCharts.com
So, what’s happening on the above chart? Over the past decade or so, gold prices have been forming a technical-analysis chart pattern called a cup and handle. This type of pattern forms when prices trade in a U-shaped “cup” pattern and then drift downward and form a “handle” pattern.
This is a bullish pattern, and once the price breaks out of the downward drift, it tends to be a solid buying opportunity, and robust gains generally follow.
Gold prices have made a sizeable increase from the cup part of the cup and handle pattern.
Now, how high could gold prices go? With a cup and handle pattern, once the price breaks out of the downward drift, technical analysts set an upside target by measuring the distance between the right peak and the bottom of the cup formation. Then, they add this number to the breakout point.
Assuming a classic cup and handle pattern plays out on gold prices, the breakout point is around $2,000 and the distance between the right peak and the bottom is around $1,000. This means gold could make a run toward a $3,000-an-ounce price.
Near-Term Gold Prices Could Soar to $2,500 an Ounce
Looking more closely, over the past few years, gold prices have been forming a technical chart pattern called an ascending triangle. Again, this isn’t a new pattern for long-term Lombardi Letter readers, but there have been some bullish developments lately.
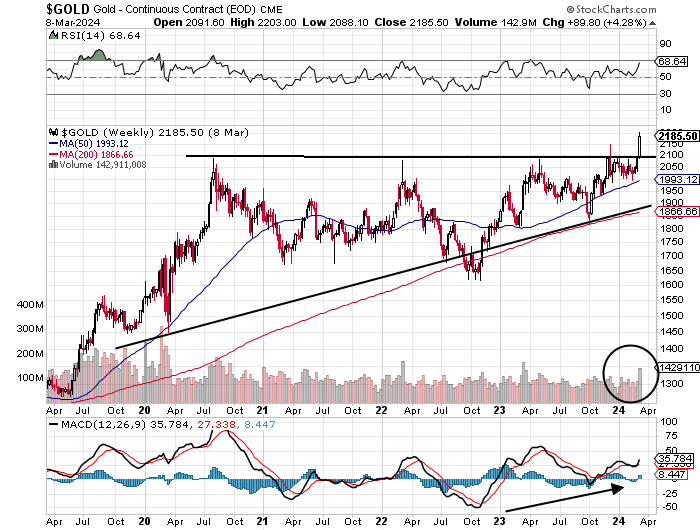
Chart courtesy of StockCharts.com
Technical analysis 101: an ascending triangle forms when there’s a prevalent uptrend that finds consistent resistance. Technical analysts get excited when a price breaks out above a resistance level.
Good news: gold has broken above the resistance level. This is a bullish sign.
How high could the price of gold fly as the ascending triangle chart pattern plays out? Chart analysts set their targets by measuring the widest part of the triangle and adding it to the breakout point.
In the above chart, the widest part of the ascending triangle is the price action between April and October 2022, and it’s roughly $400.00–$450.00 wide. The major resistance level was around $2,100. Therefore, if the ascending triangle chart pattern plays out as expected, gold could soar above $2,500 per ounce.
Gold Price Outlook Is Bright: Here’s Something to Consider
Dear reader, I can’t stress this enough: the outlook for gold prices is robust. The yellow precious metal is trading at all-time highs, and it wouldn’t be shocking to see it go much higher. As I said earlier, a $3,000-an-ounce gold price could become a reality much sooner than expected.
What I find interesting, though, is that gold mining stocks have really been ignored by investors. As the price of gold makes new highs, one would assume that gold miner stocks have been catching a bid. That hasn’t been the case.
Mining stock prices remain well below their highs, and I think there’s a lot of opportunity among them. With such high gold prices lately, many gold mining companies have been profitable and becoming cash-rich. Will the prices of gold miner stocks remain low, or will investors realize their potential and rush to buy them?